Mobile App Experience - Financial Services Benchmarking Study
Mobile apps have become an important part of the way that many people interact with businesses and organizations. A good mobile app experience can help to improve customer satisfaction, increase brand loyalty, and drive growth.
I believe that there are at least eleven (11) critical elements of a modern Mobile App Experience that one should continuously be measuring and monitoring. I’ve illustrated and then described them below.
Furthermore, I’ve performed an ‘emotional analytics’ study benchmarking four financial services Apps: Bank of America, CapitalOne, CitiBank, and Wells Fargo (see the benchmarking results below).

Customer Centric LLC - Core Elements of a Mobile App Experience
mobile app experience (Critical elements)
A secure login function (biometrics, 2FA, etc.) to give you the confidence that your personal information is secure along with simple username/password recovery.
A user-friendly, responsive interface like you’d expect from your best mobile App experiences elsewhere.
An intuitive menu structure and navigation to help you quickly accomplish your task and move on.
A robust set of application features to perform specific tasks and/or functions with as few as clicks as possible.
A quick and effective search function to find things quickly if not easily found via menus of buttons displayed.
Alerts and notifications that are timely and relevant providing you the controls you need to create a tailored experience.
A hands-free voice assistant to guide and support you with answering questions and/or performing specific functions leveraging speech recognition, natural language processing and artificial intelligence.
Ads or promotions that are personalized to your goals and objectives, not the companies.
Speed and performance to do what you need to do quickly and be done; a stable App that doesn’t crash when you need it.
A sense of trust in the App experience being engineered to provide both consumer data privacy and protection.
An integrated customer service and support function (chat, email, phone) to support you when required.
The Study
This study is based upon analyzing the degree to which four different financial services companies:
Bank of America;
CapitalOne;
CitiBank; and
Wells Fargo
deliver a well executed modern Mobile App Experience evaluating the eleven critical elements outlined above.
To perform the study I’ve evaluated over 1,000 Google Play reviews for each of the Mobile Apps, over 5,000 Google Play reviews in total.
To analyze this large dataset of open-ended, text-based employee feedback I leveraged the Adoreboard emotional AI platform. It excells at analyzing large datasets quickly and efficiently summarizing key topics and themes; scoring them based upon the 'emotions' within the product reviews.
Note: Even though this particular study is focused on analyzing product experience (using Google Play reviews), Adoreboard is an extremely useful tool for analyzing employee and/or customer reviews as well. The platform integrates with Qualtrics, Zendesk, SurveyMonkey , Twitter, and Reddit, Inc..
WHAT'S AN ADORESCORE?
An Adorescore is a single measure of the emotional performance of a dataset (collection of employee, customer, or product reviews). Adorescores are assigned to the entire dataset as well as to sub-sets of the dataset related to individual topics or themes (more on this later).
An Adorescore is measured on a scale of -100 to +100. The higher the number the greater the level of positive emotions. The lower the score the greater the presence of negative emotions.
Adorescores are classified as follows: Very Poor: -100 to -36; Poor: -35 to -15; Fair: -14 to 24; Good: 25 to 43; and Very Good: 44 to 100.
Mobile app experience (competitive Benchmarking)
Here is how the four companies benchmarked across the eleven (11) core elements of a modern Mobile App Experience. The #s highlighted represent the Adorescore for an individual element relative to their competitor.
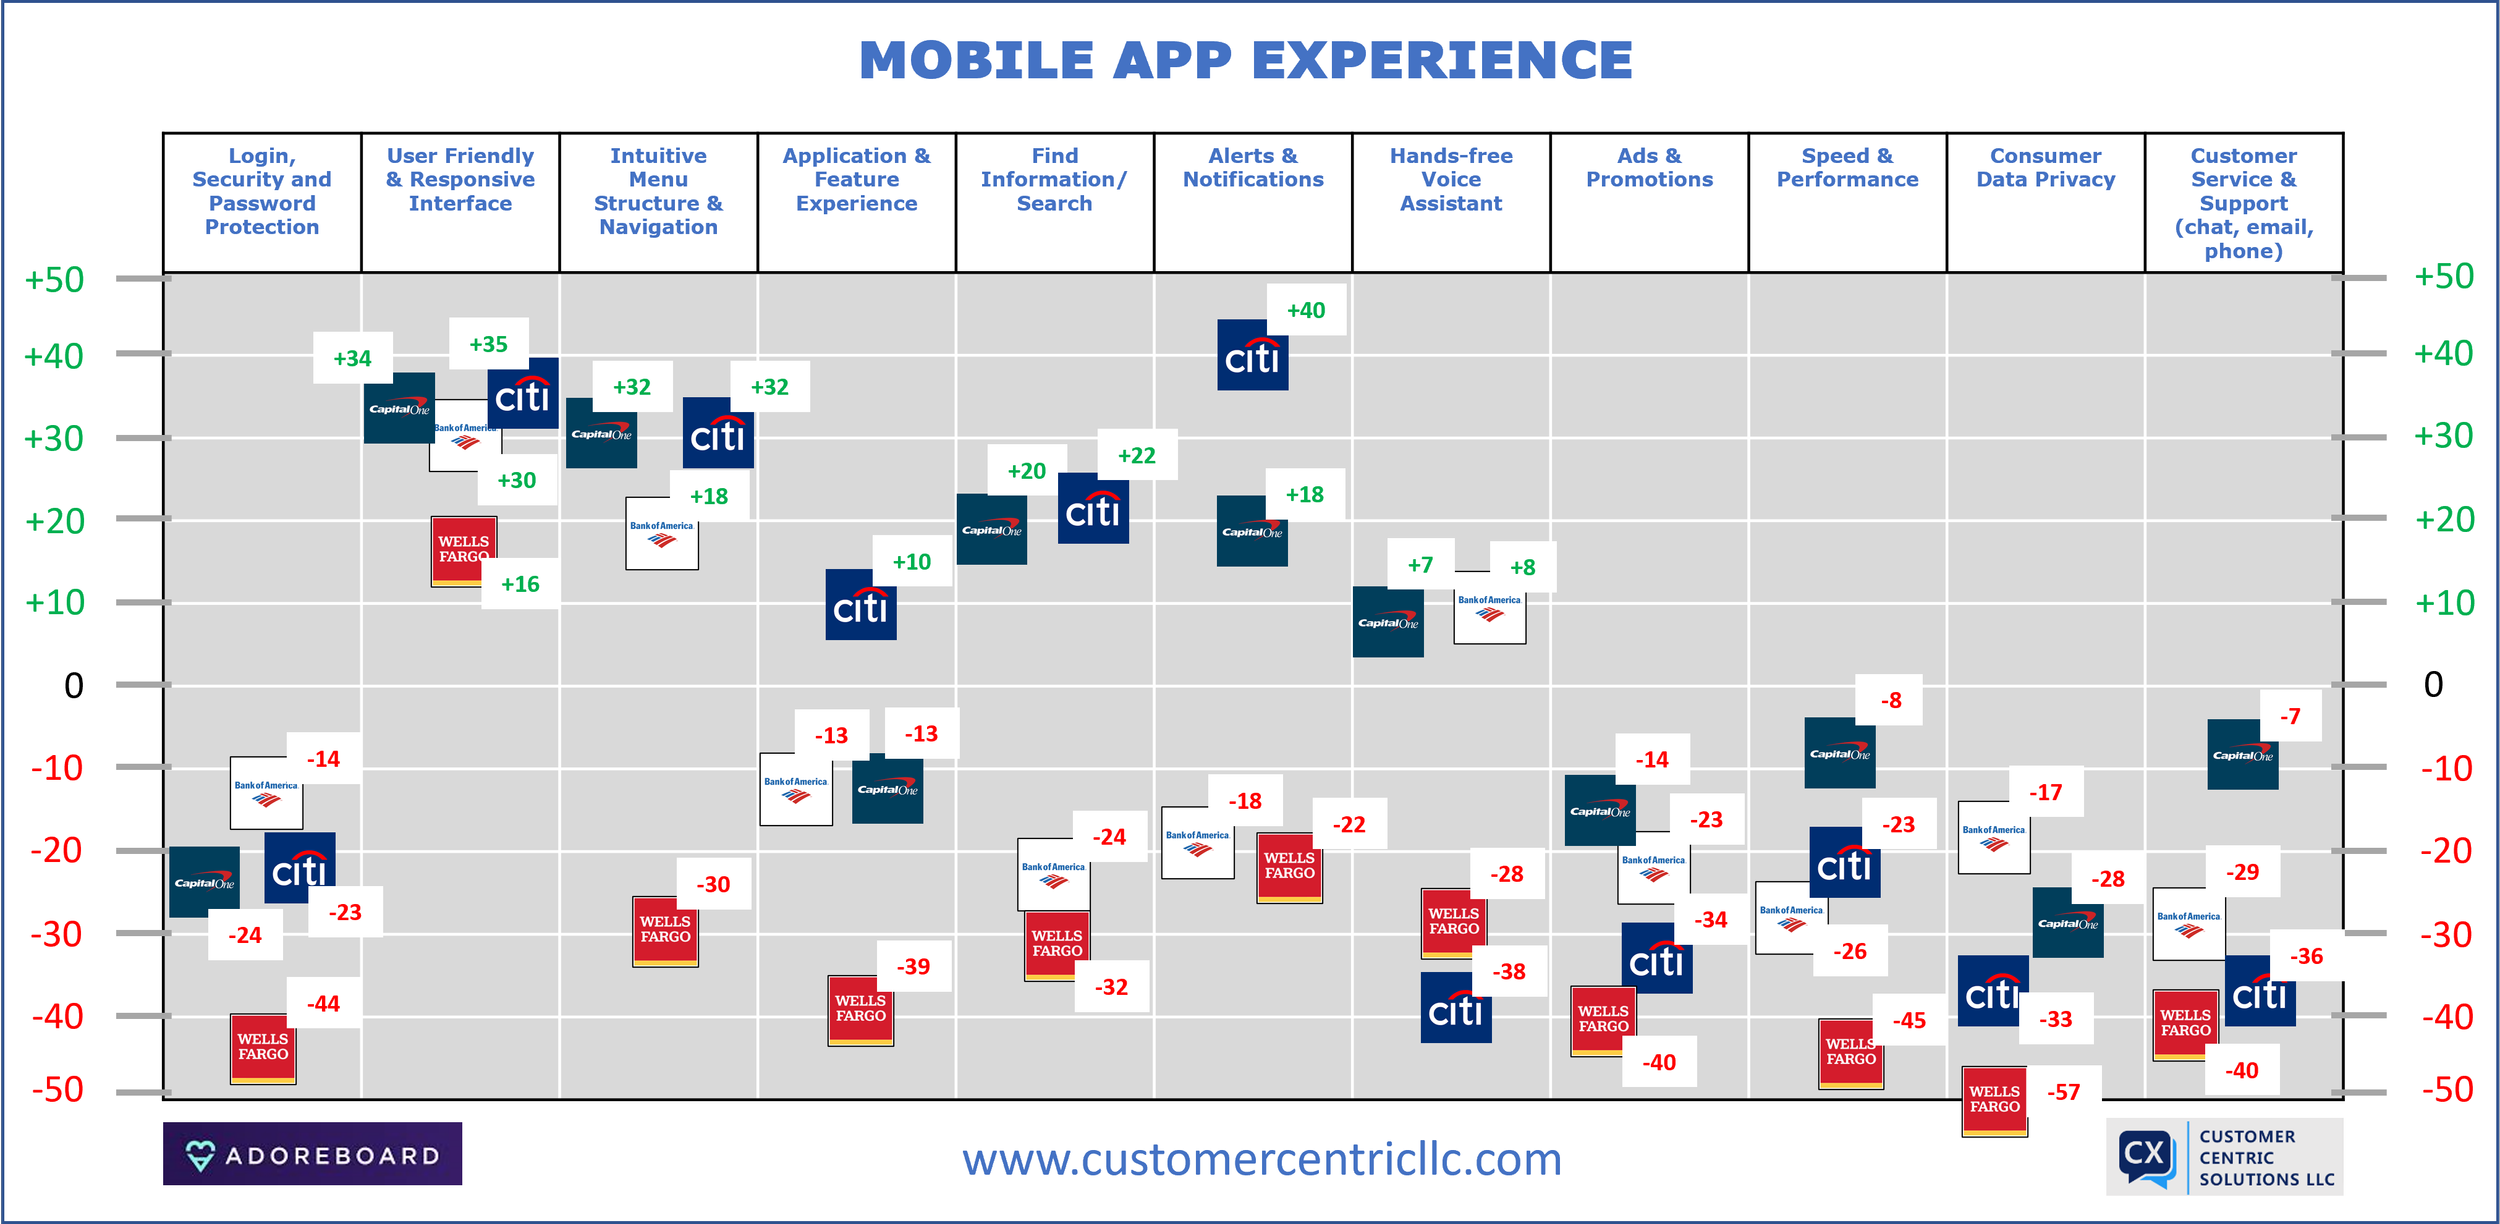
Bank of America performed as follows:
Overall: 26% Adored; 47% Ignored; and 27% Floored.
Very Good (+44 to 100): n/a
Good (+25 to +43): User Friendly & Responsive Interface [+30]
Fair (-14 to +24): Intuitive Menu Structure & Navigation [+18]; Hands-free Voice Assistant [+8]; Application & Feature Experience [-13]; Login, Security and Password Protection [-14].
Poor (-15 to -35): Consumer Data Privacy [-17]; Alerts & Notifications [-18]; Ads & Promotions [-23]; Find Information/Search [-24]; Speed & Performance [-26]; and Customer Service & Support [-29].
Very Poor (-36 to -100): n/a
CapitalOne performed as follows:
Overall: 35% Adored; 31% Ignored; and 35% Floored.
Very Good (+44 to 100): n/a
Good (+25 to +43): User Friendly & Responsive Interface [+34]; Intuitive Menu Structure & Navigation [+32]; and Alerts & Notifications [+18].
Fair (-14 to +24): Find Information/Search [+20]; Hands-free Voice Assistant [+7]; Customer Service & Support [-7]; Application & Feature Experience [-13]; and Ads & Promotions [-14].
Poor (-15 to -35): Speed & Performance [-8]; Login, Security and Password Protection [-24]; and Consumer Data Privacy [-28].
Very Poor (-36 to -100): n/a
CitiBank performed as follows:
Overall: 36% Adored; 31% Ignored; and 33% Floored.
Very Good (+44 to 100): n/a
Good (+25 to +43): Alerts & Notifications [+40]; User Friendly & Responsive Interface [+35]; and Intuitive Menu Structure & Navigation [+32].
Fair (-14 to +24): Find Information/Search [+22]; and Application & Feature Experience [+10].
Poor (-15 to -35): Login, Security and Password Protection [-23]; Speed & Performance [-23]; Consumer Data Privacy [-33]; and Ads & Promotions [-34].
Very Poor (-36 to -100): Customer Service & Support [-36] and Hands-free Voice Assistant [-38].
Wells Fargo performed as follows:
Overall: 27% Adored; 31% Ignored; and 41% Floored.
Very Good (+44 to 100): n/a
Good (+25 to +43): n/a
Fair (-14 to +24): User Friendly & Responsive Interface [+16]
Poor (-15 to -35): Alerts & Notifications [-22]; Hands-free Voice Assistant [-28]; Intuitive Menu Structure & Navigation [-30]; Find Information/Search [-32]
Very Poor (-36 to -100): Application & Feature Experience [-39]; Customer Service & Support [-40]; Ads & Promotions [-40]; Login, Security and Password Protection [-44]; Speed & Performance [-45]; and Consumer Data Privacy [-57].
Note: There is a great deal of further detail to be found in the ‘emotional analytics’ performed by Adoreboard which is not represented in this overview. Specifically, emotional responses were captured around more detailed features and/or activities such as: biometric login, bank account, home screen, card application, interest rate, debit card, bill pay, mobile deposits, balance transfers, overdraft fees, error messages, Zelle, and more. Reach out to Talk with Us if you wish to learn more about the study.
Mobile app experience (Theme Analysis)

Bank of America highlights are as follows:
Stats: 1,602 comments, 111 Themes, 89 Subtopics. Above chart represents 11 summarized Themes.
Potential areas of focus might include:
Issues to Be Eliminated
Login, Security, and Password Protection [-14]: It is driving 8% of the conversation and 57% more Apprehension than the dataset as a whole. Important to eliminate this issue to improve customer experience. Resolve as this is a threat to customer experience.
Speed & Performance [-26]: Performing quite poorly relative to competitors; represents a significant threat to customer experience. It is only driving 4% of the conversation but 65% more Disgust than the dataset as a whole.
Should be Investigated
Application & Feature Experience [-13]: Is a considerable threat to customer experience as it is driving 21% of the conversation and 65% more Disgust than the dataset as a whole. Should analyze more detailed sub-topics (features) for positive vs negative emotional drivers.
Threat to be Addressed
Find Information/Search [-24]: Performing quite poorly relative to competitors; represents a significant threat to customer experience. It is only driving 4% of the conversation but 98% more Anger than the dataset as a whole.
Area for Growth
Hands-free Voice Assistant [+8]: Continue to invest in Erica AI feature set given positive emotional response. It represents an opportunity to further improve customer experience. It appears to still have low adoption, only driving 2% of the conversation, however, it represents 49% more Joy than the dataset as a whole.
Additional Adoreboard features allow you to categorize ALL topics/themes using a SWOT analysis grid (strength, weakness, opportunity, threat).

Capital One highlights are as follows:
Stats: 801 comments, 111 Themes, 105 Subtopics. Above chart represents 11 summarized Themes.
Potential areas of focus might include:
Issues to be Eliminated
Login, Security, and Password Protection [-24]: Address any critical issues with this feature set, as it represents a threat to customer experience. It is driving 34% of the conversation and 9% less Joy than the dataset as a whole.
Threat to be Addressed
Consumer Data Privacy [-28]: Make sure to address this threat whether real or perceived. Driving 2% of the conversation and 62% more Disgust than the dataset as a whole.
Should Be Investigated
Application & Feature Experience [-13]: Is a considerable threat to customer experience, negative Adorescore. It is driving 43% of the conversation and 7% more Disgust than the dataset as a whole. Should analyze more detailed sub-topics (features) for positive vs negative emotional drivers.
Take Advantage Of
User Friendly & Responsive Interface [+34]: Continue to focus on UX innovation, Opportunity to further improve customer experience. Performing well against the competition. Driving 34% of the conversation and 32% more Surprise than the overall dataset.
Hands-free Voice Assistant [+7]: Continue to invest in Eno Bot assistant given positive emotional response. It represents an opportunity to further improve customer experience. It appears to still have low adoption, only driving 2% of the conversation, however, it represents 7% more Joy than the dataset as a whole.
Additional Adoreboard features allow you to categorize ALL topics/themes using a SWOT analysis grid (strength, weakness, opportunity, threat).
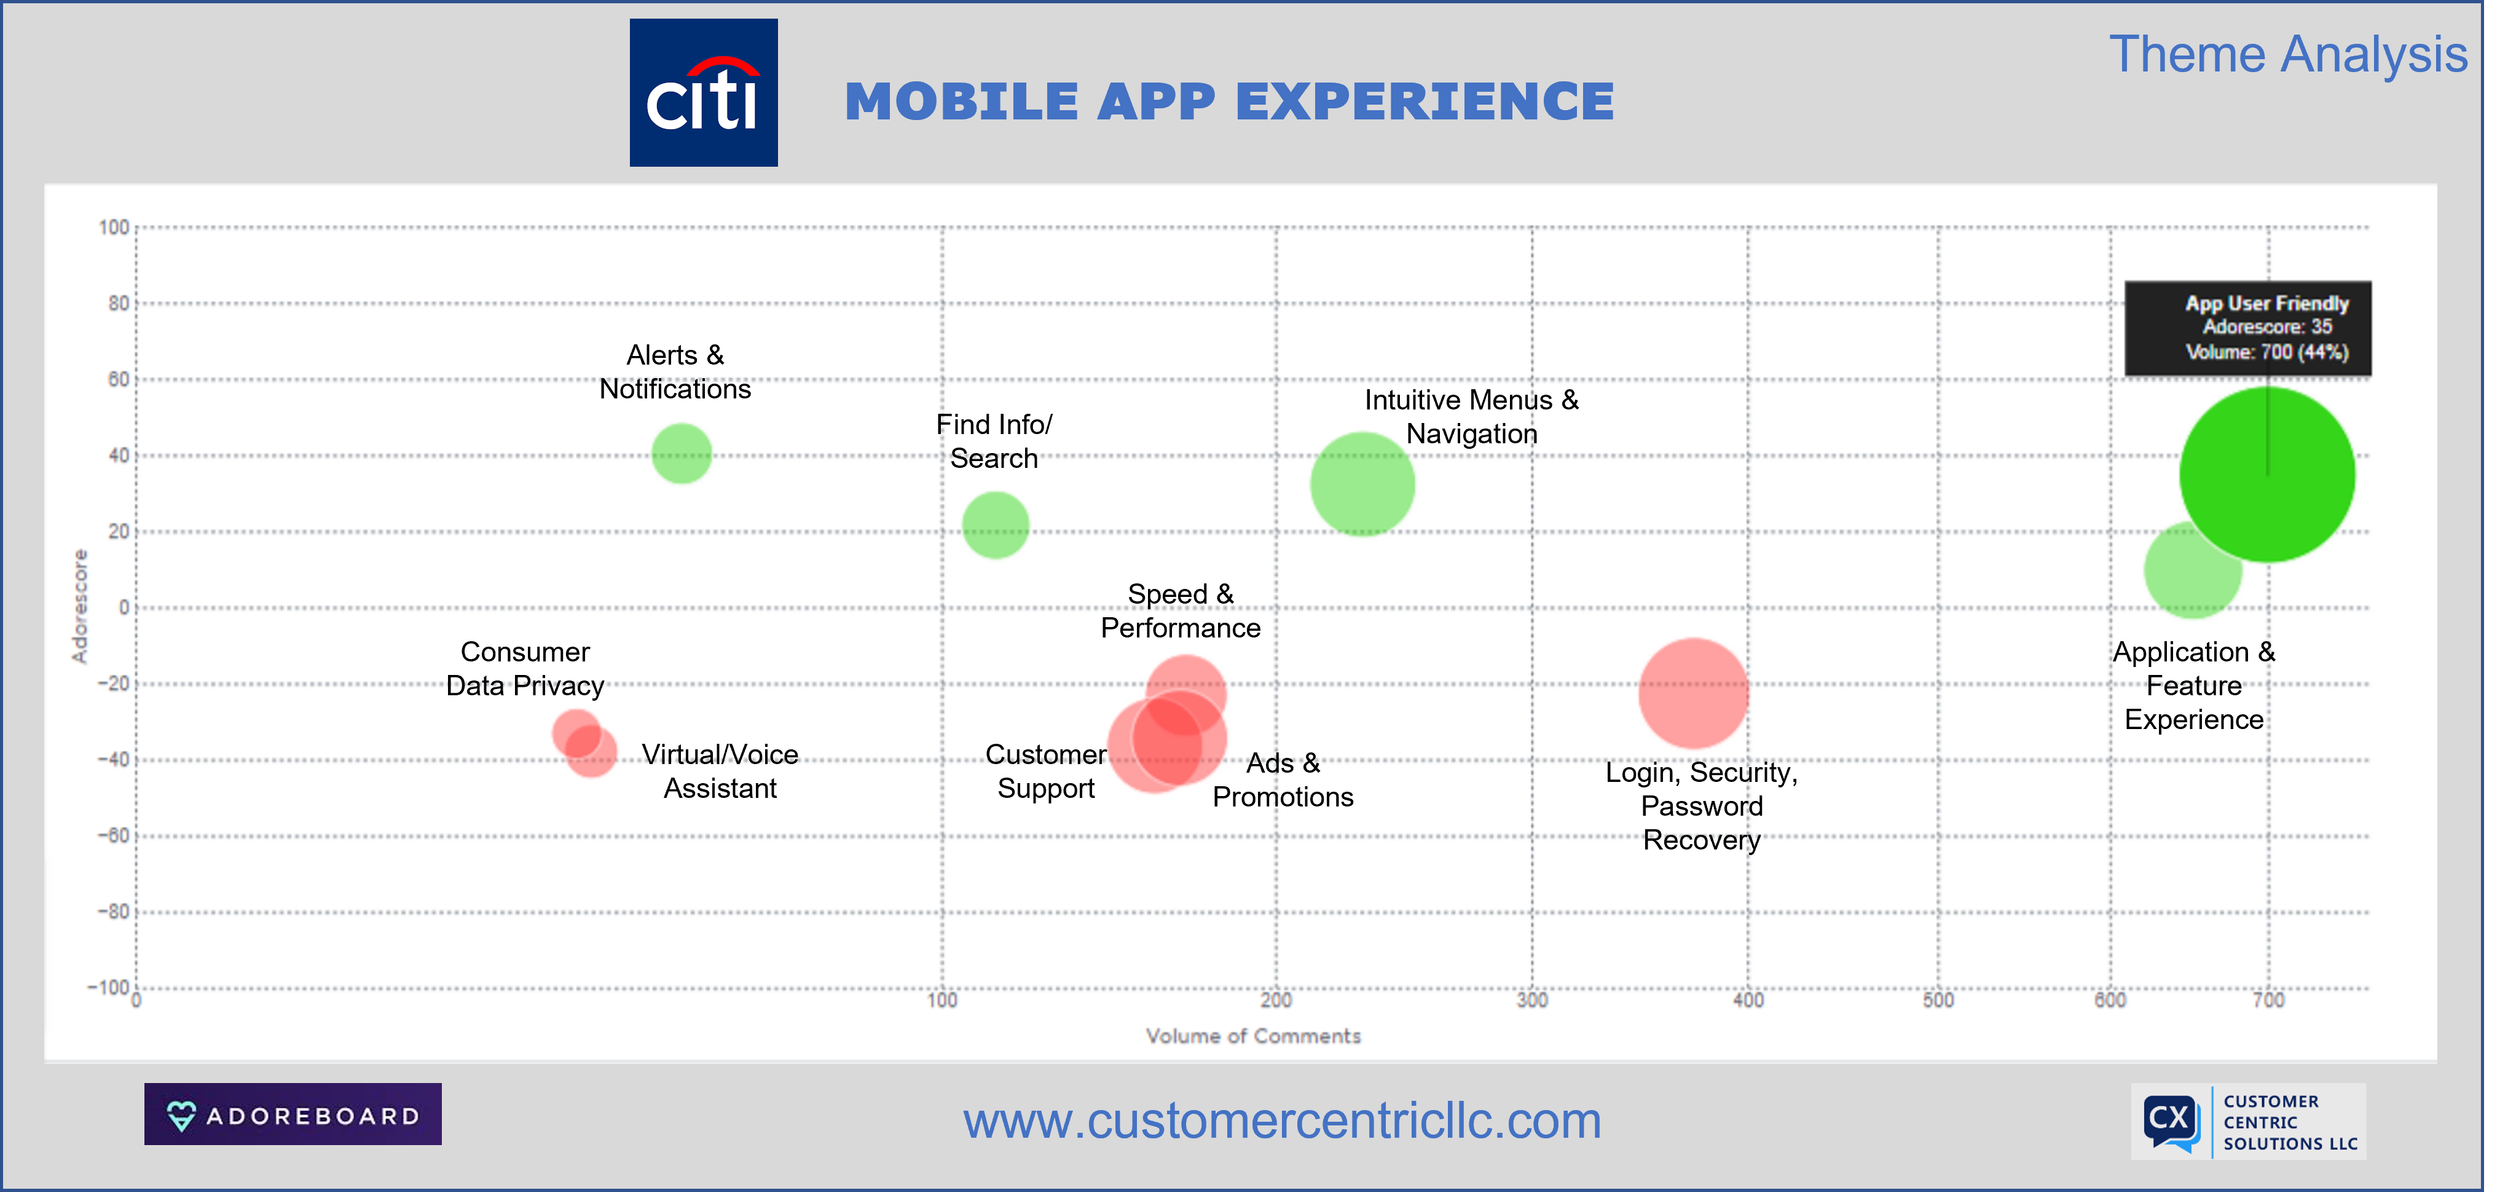
CitiBank highlights are as follows:
Stats: 1,601 comments, 111 Themes, 104 Subtopics. Above chart represents 11 summarized Themes.
Potential areas of focus might include:
Needs a Boost
Application & Feature Experience [+10]: A competitive differentiator, but, still having opportunity to further improve customer experience. Driving 41% of the conversation but represents 1% less Joy than the overall dataset. Evaluate individual feature sets in terms of positive vs. negative emotional responses. Take necessary action.
Cause for Concern
Ads & Promotions [-34]: A weakness being worst performer amongst competitors. Driving 10% of the conversation and represents 39% more Anger than the overall dataset. Need to rethink strategy and approach given negative Adorescore.
Customer Service & Support [-36]: Among worst performers in this area, a weakness for sure. Driving 10% of the conversation and representing 36% more Anger than the dataset as a whole.
Take Advantage Of
Find Information/Search [+22]: A Strength, outperforming all competitors in this particular area. Continue to invest in it given highly positive experience for customers. Driving 7% of the conversation and represents 6% more Surprise than the overall dataset.
Potential for Development
Hands-free Voice Assistant [-38]: Worst performer amongst competitors (positive emotions in this area). Opportunity for further investment in this area to improve customer experience. Driving 2% of the conversation but represents 46% more sadness than the dataset as a whole.
Additional Adoreboard features allow you to categorize ALL topics/themes using a SWOT analysis grid (strength, weakness, opportunity, threat).
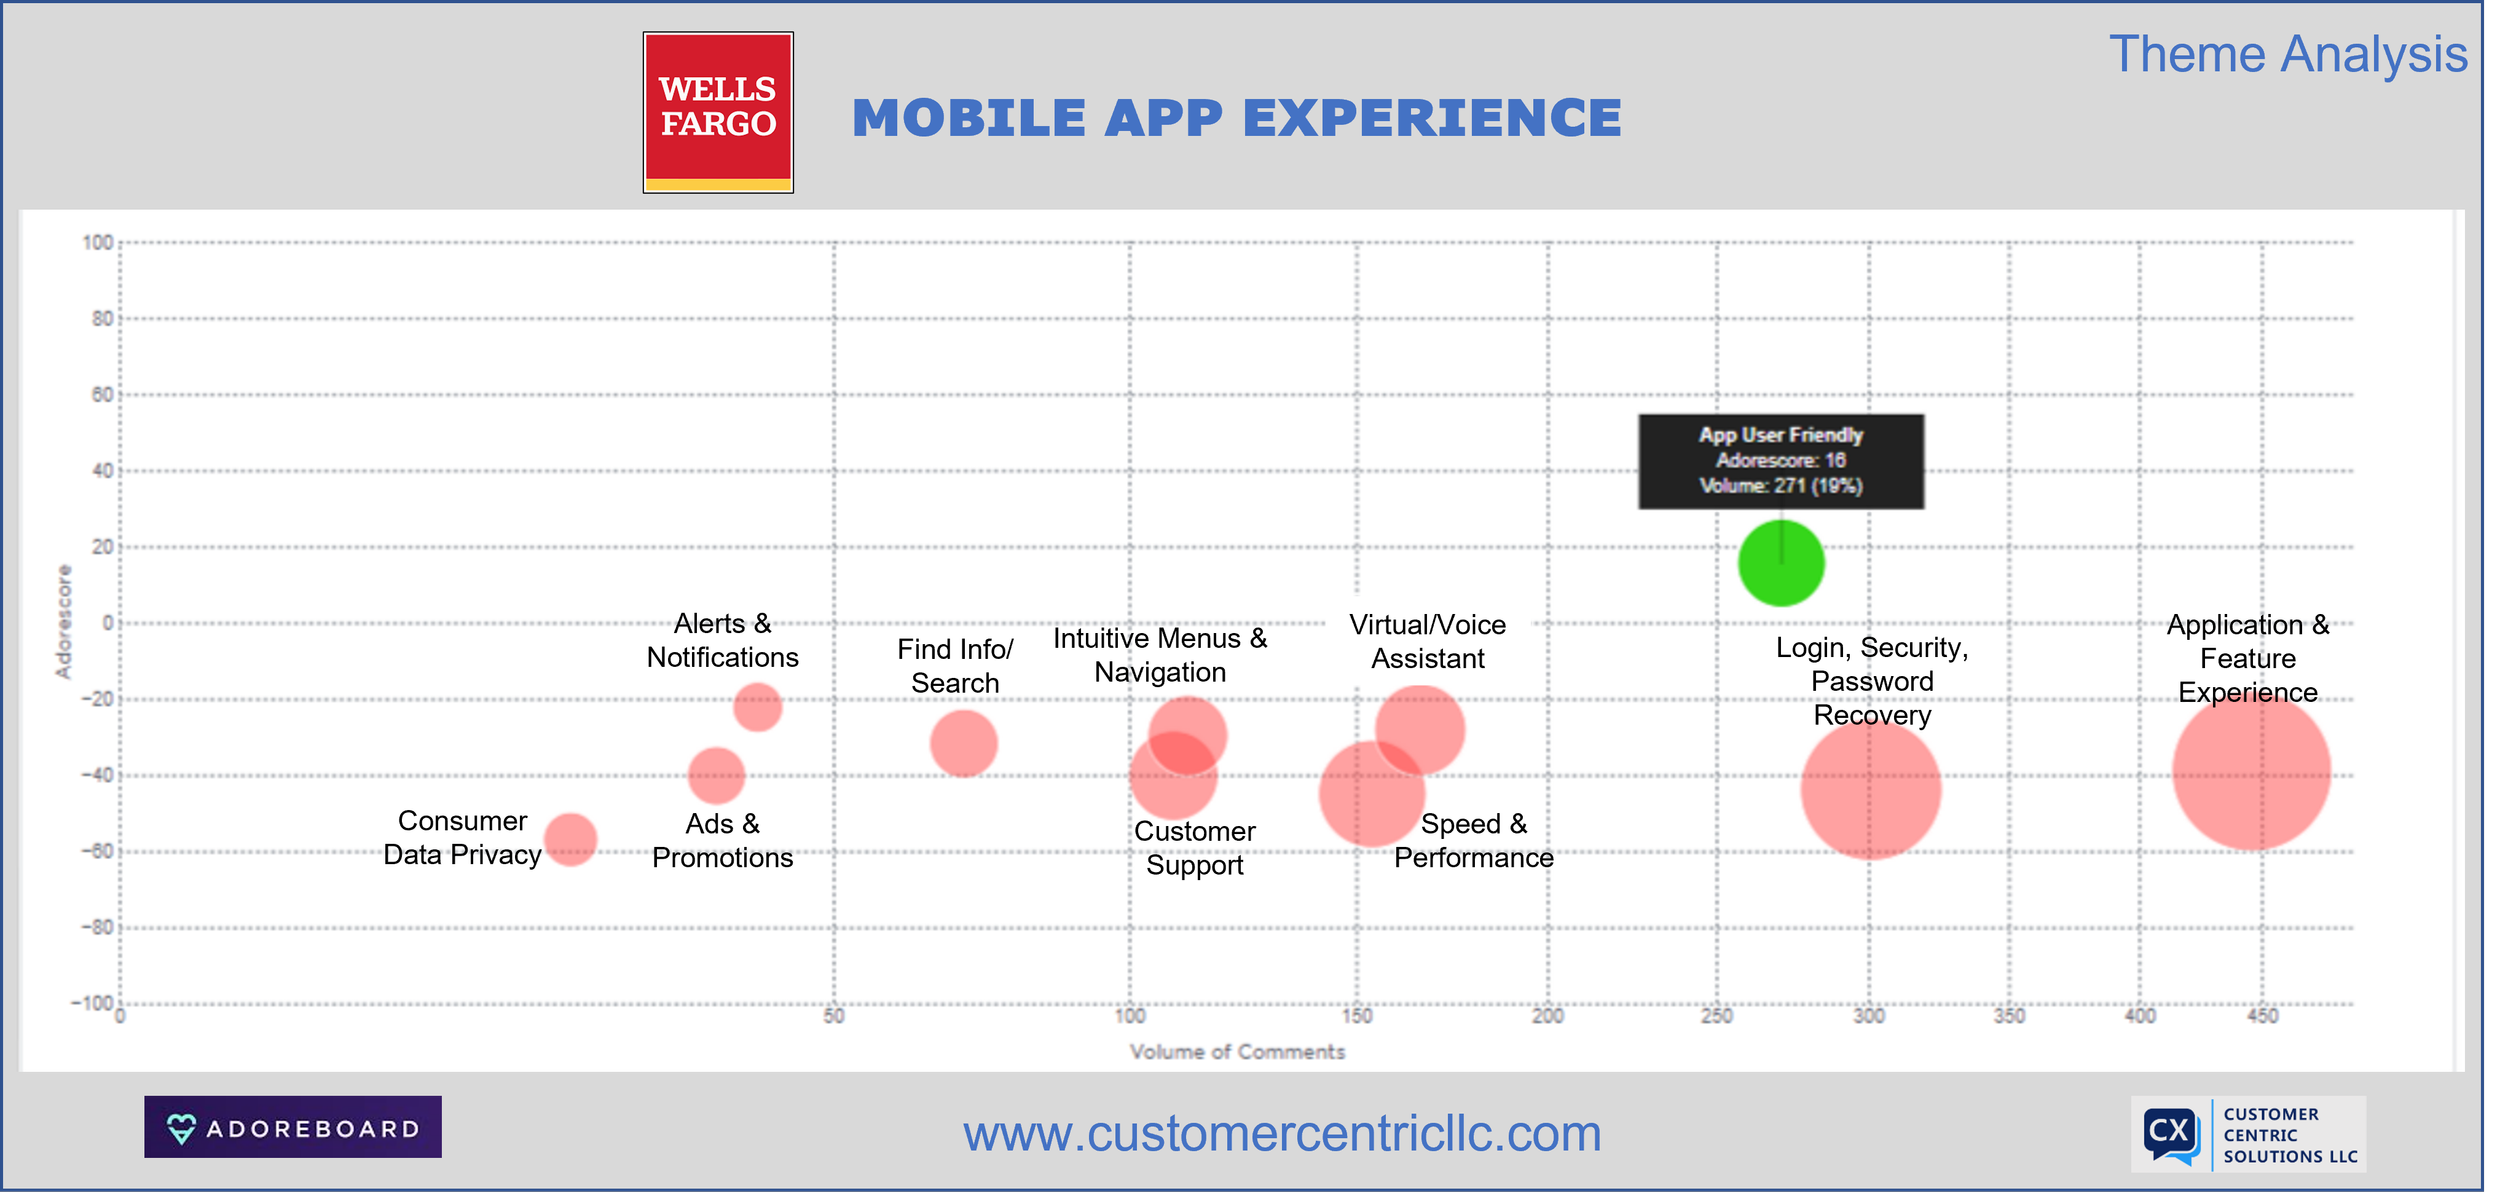
Wells Fargo highlights were as follows:
Stats: 1,450 comments, 111 Themes, 134 Subtopics. Above chart represents 11 summarized Themes.
Potential areas of focus might include:
Cause for Concern
Application & Feature Experience [-39]: Significant weakness, worst performer amongst competitors. Driving 31% of the conversation and representing 10% more Disgust than the overall dataset. Investigate which specific features are driving positive vs. negative emotions from customers. Take action on them.
Issue to be Eliminated
Login, Security, and Password Protection [-44]: Worst performer amongst competitors; a significant weakness. Driving 21% of the conversation and representing 10% more Anger than the dataset as a whole.
Speed & Performance [-45]: Worst performer amongst competitors; a significant weakness. Driving 11% of the conversation and representing 68% more Apprehension than the overall dataset.
Threat to be Addressed
Find Information/Search [-32]: A significant threat to customer experience. Driving 5% of the conversation and representing 11% more Disgust than the dataset as a whole. Resolve any issues related to this feature set.
Area for Growth
User Friendly & Responsive Interface [+16]: Positive emotions but still worst performer amongst competitors. Opportunity for continuous improvement. Driving 19% of the conversation and representing 26% more Joy than the overall dataset.
Additional Adoreboard features allow you to categorize ALL topics/themes using a SWOT analysis grid (strength, weakness, opportunity, threat).
In Summary
Continuous Product Discovery is a discipline that all product teams need to infuse into their product development practices - infusing the voice of the customer (input/feedback) into daily product decisions. Emotional analytics is a powerful method of incorporating this feedback as it provides a framework for assessing, based on intensity level, the positive or negative reactions to a product’s design, feature set, and usage.
Adoreboard is a powerful platform for doing this type of Continous Product Discovery in that it performs alot of the heavy lifting on your behalf, helping you quickly analyze, assign emotional scores, to different topics/themes within your dataset. Take Action on the items that will drive the most improvement in customer experience.
If you wish to learn more about this study or discuss how you might enhance the methods by which you perform Continuous Product Discovery reach out and Talk with Us at www.customercentrillc.com.